Subtotal ₹0.00







Email :27
Residential sales across India’s top 8 metro cities stood at 1,22,854 units in the July–September 2026 quarter, up 1.0% from 1,21,658 units in the April–June 2026 quarter. New launches rose 7.6% quarter-on-quarter to 1,13,391 units, while unsold inventory rose 2.7% to 8,65,584 units. The weighted average carpet rate across the Top 8 Metros remained almost flat, with a slight decline of 0.4% to ₹16,184 per sq. ft., from ₹16,254 per sq. ft. in the previous period.
The figures are indicative and reflect market activity tracked up to 27 September 2026.
Key highlights
- Sales: 1,22,854 units, up 1.0% QoQ. Five of eight cities recorded growth.
- Fastest sales growth: Chennai (+4.7%), Ahmedabad (+4.2%), Pune (+2.8%) and Hyderabad (+2.5%).
- Sales dips: NCR (-2.4%), Bangalore (-0.5%) and MMR (-0.1%).
- New launches: 1,13,391 units, up 7.6% QoQ, led by MMR, Pune and Kolkata.
- Unsold inventory: 8,65,584 units, up 2.7% QoQ. Kolkata was the only city where inventory fell.
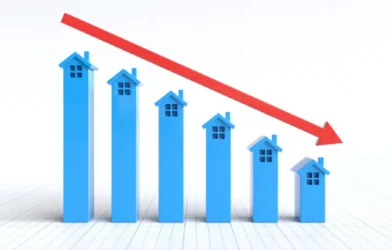
- Prices: The weighted average carpet price saw a slight decline of 0.4% to ₹16,184 per sq. ft.
- Kolkata (+5.6%), Chennai (+4.5%) and Pune (+1.8%) saw the highest increases.
- NCR prices fell 4.8% to ₹14,568 per sq ft, making MMR (₹15,417 per sq ft) the costliest of the 8 markets.
- MMR remains the largest market, accounting for about 28% of sales and 30% of unsold inventory across the top 8 cities
City-wise performance
MMR: Sales were flat at 34,552 units (-0.1%). Developers stepped up supply sharply, with launches rising 18.7% to 30,262 units. Unsold stock edged up 0.4% to 260,629 units. Prices rose 1.3% to ₹25,199 per sq. ft., now the highest among the eight cities.
Bangalore: Sales slipped 0.5% to 16,260 units, while launches fell 3.4% to 12,155 units. Bangalore remains the second-largest market by sales, narrowly ahead of Pune. Unsold inventory rose 1.3% to 91,714 units. Carpet prices rose 0.4% to ₹12,942 per sq. ft.
Pune: Sales grew 2.8% to 16,057 units. Pune recorded the second-highest launch volume among the eight cities, with launches rising 12.8% to 18,235 units. With launches outpacing sales, unsold inventory rose 6.1% to 116,872 units. Carpet prices rose 1.8% to ₹11,636 per sq. ft.
NCR: Sales declined 2.4% to 15,457 units, the steepest decline among the eight cities. Launches increased 6.7% to 14,188 units, while unsold inventory remained steady at 58,407 units (0.0%), the leanest among the large markets. NCR’s average rates declined 5.9% to ₹22,115 per sq. ft., primarily due to the lower average pricing of new launches. In the September 2026 quarter, NCR saw 10,094 apartments launched at an average carpet price of ₹21,551 per sq. ft.
Hyderabad: Sales rose 2.5% to 14,903 units, while launches remained stable at 16,165 units (-0.6%). Unsold inventory recorded the sharpest rise among the eight cities, increasing 8.6% to 114,261 units. Apartment prices were broadly stable, rising 0.1% to ₹11,511 per sq. ft.
Ahmedabad: Sales grew 4.2% to 11,066 units, while launches remained flat at 10,261 units (-0.1%). Unsold inventory rose 5.5% to 108,028 units. Apartment prices increased 1.2% to ₹8,685 per sq. ft.
Chennai: Sales recorded the strongest growth among the eight cities, rising 4.7% to 9,505 units. Launches remained flat at 8,000 units (-0.2%), while unsold inventory was stable at 82,002 units (+0.1%). Apartment prices rose 4.5% to ₹7,902 per sq. ft., the second-highest increase after Kolkata.
Kolkata: Sales remained steady at 5,054 units (+0.5%). Launches jumped 25.6% to 4,125 units, the highest growth among the eight cities. Kolkata was the only market where unsold inventory declined, falling 2.3% to 33,671 units. Apartment prices rose 5.6% to ₹5,949 per sq. ft., the highest increase among the eight cities.
Outlook
Housing demand across the top 8 cities remained stable in July-September 2026, with sales of 1.23 lakh units, up 1.0% QoQ. Developers are adding supply faster than demand is growing. New launches rose 7.6%, and launches now equal about 92% of quarterly sales, up from about 87% in April-June. As a result, unsold inventory rose 2.7% to 8.66 lakh units, and Kolkata was the only city where it fell.
Pricing was mixed. The weighted average carpet rate eased 0.4% to ₹16,184 per sq. ft., even though seven of eight cities saw increases, led by Kolkata (+5.6%), Chennai (+4.5%) and Pune (+1.8%). The overall decline comes mainly from NCR, where average rates fell 5.9% as lower-priced new launches pulled down the average.
At the current sales pace, unsold stock equals about 21 months of sales. NCR has the leanest overhang at about 11 months, while Ahmedabad (about 29 months), Chennai (about 26 months) and Hyderabad (about 23 months) carry the most. The coming festive season will test whether sales can keep pace with new supply, especially in Pune and Hyderabad, where inventory is building fastest.
“New launches have continued to show consistent growth, and with the festive season approaching, we expect launch activity to strengthen further. This should support stable residential sales, with the possibility of a modest improvement in overall market activity. However, the ongoing West Asia crisis and the correction in equity markets could weigh on sentiment, particularly in the luxury and ultra-luxury segments, where purchasing decisions are more sensitive to wealth effects and market confidence, said Pankaj Kapoor, Managing Director, Liases Foras.